RaftWorks
Every provider on one map
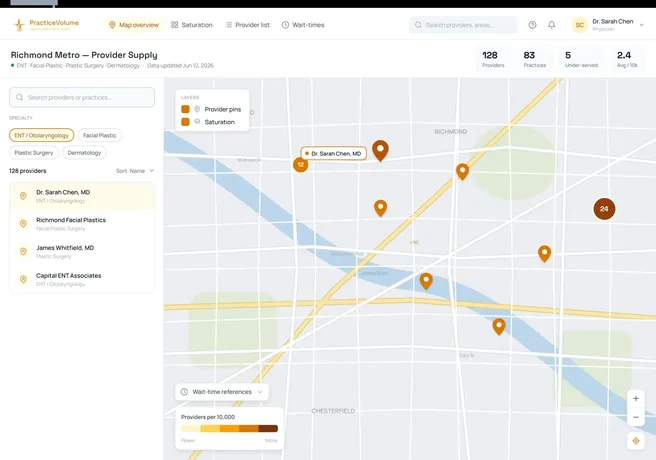
Practices and providers mapped by specialty and location, with a list view that stays in sync with the map and a detail card for each provider from public registry data.
See it in Practice Volume AnalyzerWe build healthcare market analysis tools that map every provider by specialty and location, show typical wait times, and shade areas by providers per 10,000 residents so under-served markets stand out. Built on public data only, with no patient information.
Free call · Fixed-scope quote within 48h
Each feature below is running in production in the case study it links to.
Practices and providers mapped by specialty and location, with a list view that stays in sync with the map and a detail card for each provider from public registry data.
See it in Practice Volume AnalyzerAreas shaded by providers per 10,000 residents, switchable between county and ZIP level, with a read-out naming the most under-served areas for the current specialty.
Typical waits to get an appointment, drawn from cited public benchmarks, so access as well as supply is visible.
Low-population areas are flagged so noisy ratios never mislead, every layer shows its source, and a scheduled job refreshes the data weekly with a visible last-updated date.
The build this page is based on, documented end to end. Browse all case studies.
Directories built for patients to book appointments show individual providers, but never supply against demand across an area. A practice deciding where to grow needs the opposite view: how many providers of a specialty serve how many residents, and where the waits are long.
Practice Volume Analyzer assembled that view for ENT, facial plastic and plastic surgery in Richmond, Virginia, entirely from public sources.
For a tool that informs investment decisions, provenance matters as much as the map. Each layer names the dataset it draws from and when it was last refreshed, and every wait-time figure carries its citation.
Fixed scope, a demo every Friday, and a first clickable version around day 7. The full process is on the home page.
For clinics, practices and care providers replacing paper, spreadsheets or phone tag with a tool built around how they work.
4 to 6 wksAdd-onsAI features · data migration from your spreadsheets · mobile app · monthly support retainer
Fixed scope · Fixed price
Demo every Friday
Everything else gets answered on the scoping call.
Software that maps providers by specialty and geography against population, so you can see where a specialty is under-served and where expansion makes sense.
No. It is built entirely on public datasets such as the NPPES provider registry and US Census population data, with no patient accounts and no PHI.
Yes. The pilot covered three specialties in one US metro; the same layers can be built for other specialties and regions where public provider and population data exists.
A scheduled job re-pulls the provider registry and recomputes saturation weekly, and the last-updated date is shown throughout the tool.
Typically 4 to 6 weeks to a working map for your specialties and region, as a fixed-scope, fixed-price build quoted within 48 hours of the scoping call.
Bring the spreadsheet or process you want to replace. In 30 minutes we map the tool, recommend a stack and send a fixed-scope quote within 48 hours.